




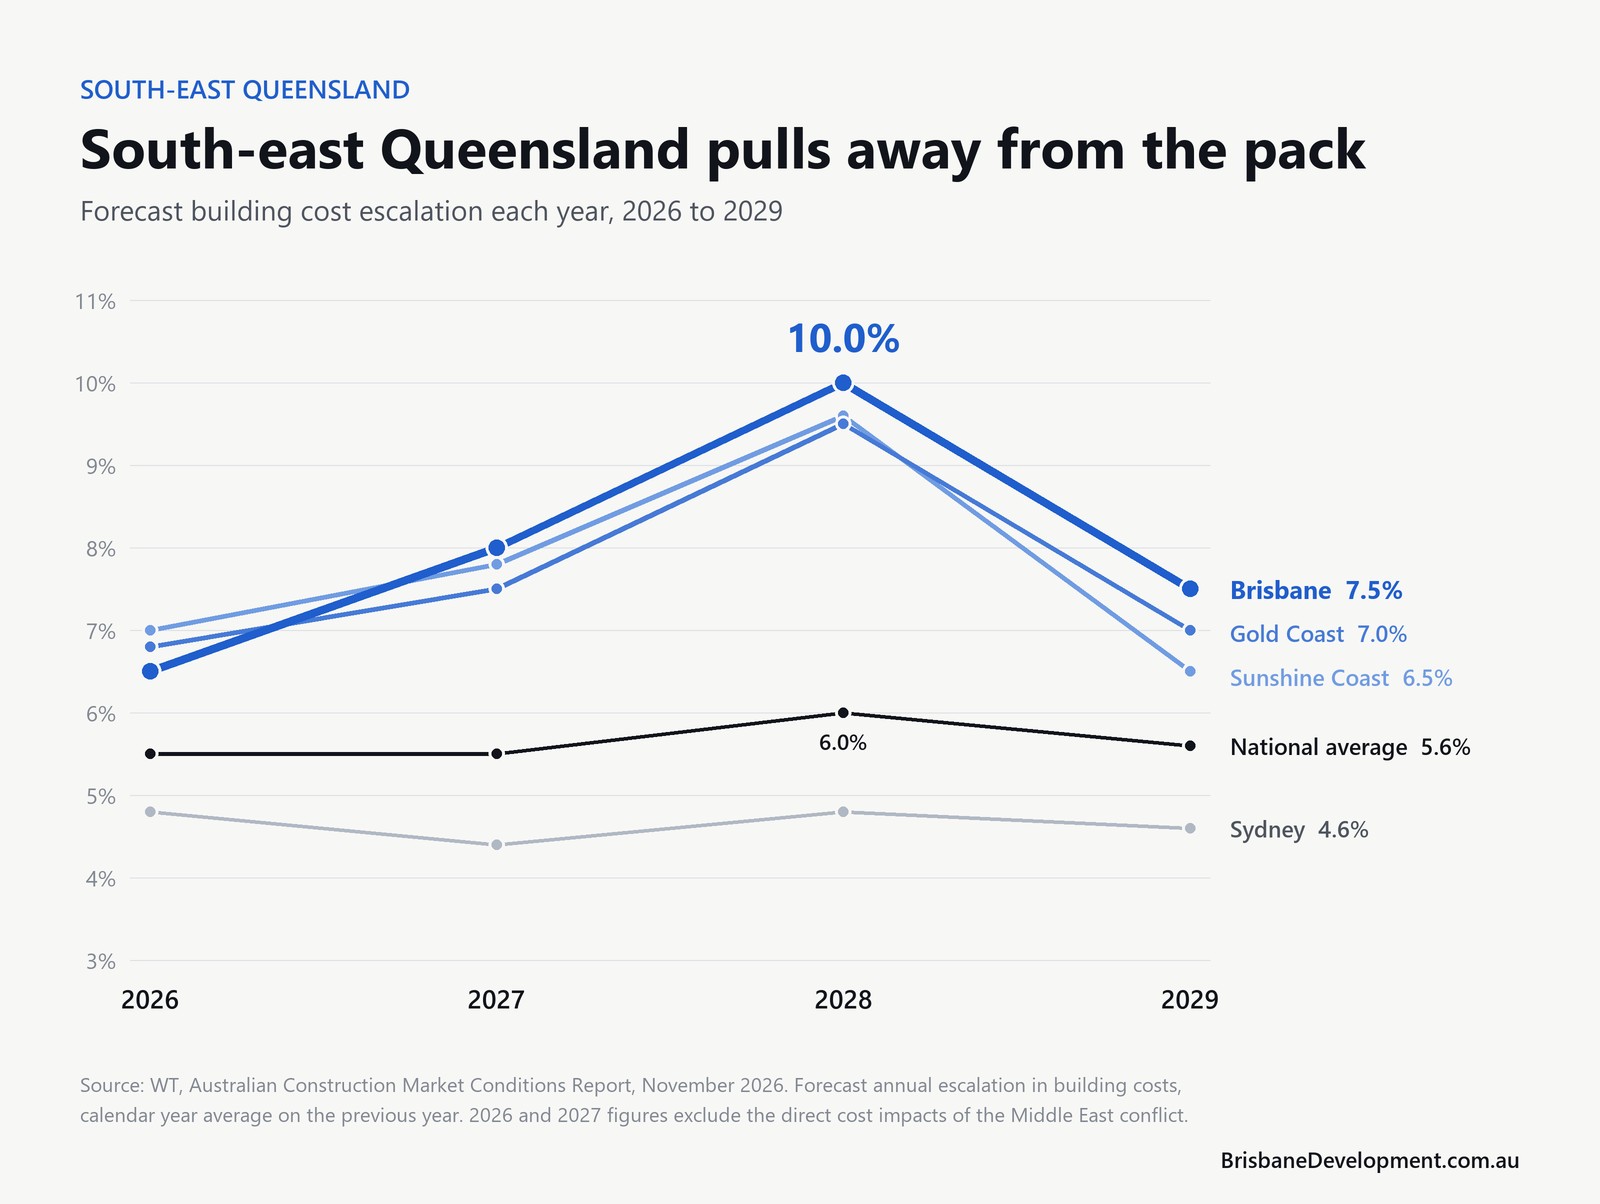
Building costs in Brisbane are forecast to rise by 10.0 per cent in 2028, the fastest rate of any major Australian market, as the city’s construction pipeline heads towards its peak on the road to the 2032 Olympic and Paralympic Games.
The forecast comes from the November 2026 edition of the Australian Construction Market Conditions Report by project advisory firm WT, which tracks cost escalation across 13 markets. It puts south-east Queensland at the top of the national table for the rest of the decade, with the Sunshine Coast at 9.6 per cent and the Gold Coast at 9.5 per cent in 2028, against a national average of 6.0 per cent.

Nationally, WT expects building costs to rise 5.5 per cent in 2027, 6.0 per cent in 2028 and 5.6 per cent in 2029. Infrastructure costs are forecast to climb steadily from 5.0 per cent in 2027 to 5.7 per cent in 2029, overtaking building by the end of the period. All of those figures sit well above the 3 per cent baseline the report uses as its reference point.
Brisbane stands apart. WT forecasts building escalation in the city of 8.0 per cent in 2027, 10.0 per cent in 2028 and 7.5 per cent in 2029, an average of 8.5 per cent a year, with infrastructure averaging 7.7 per cent a year over the same period. The Gold Coast and the Sunshine Coast are each forecast to average 8.0 per cent a year for building.
The reason is the sheer volume of work. The report describes Brisbane as having “a very healthy pipeline, limited options to accommodate extra resources and a sector broadly at capacity”, and expects construction commencements across Brisbane and south-east Queensland to be around peak levels in 2028. It also flags the potential for major data centre projects in the region, a sector that has not previously been a feature of the local pipeline.
Labour is the pressure point. WT notes that strong population growth and migration into Queensland in recent years have produced little corresponding increase in the construction workforce, and that Brisbane is on track for a 12 year low in net interstate migration, with a shortage of housing limiting the number of workers who can relocate. The firm sees more promise in the vocational training pipeline, and says it is increasingly likely that some proposed projects will be postponed as the industry works through the peak. Earlier this year WT forecast a construction labour shortfall of up to 46,000 workers in Queensland by 2028 to 2029.

Compounded over three years, the forecasts add up. On Brisbane Development’s calculation from WT’s figures, a building priced at $100 million in 2026 would cost about $127.7 million by 2029 in Brisbane, compared with $118.1 million on the national average and $114.4 million in Sydney.

WT Construction Economist Damon Roast said activity was expected to stay strong across many sectors, even with higher interest rates, elevated oil prices and the risk of an artificial intelligence investment bubble in the background. The report sees those economic risks peaking in 2028, the same year activity is forecast to peak.
If those risks materialise, some projects may be paused and cost pressures could ease for a time. But unless it turns into a deep downturn, that relief will be short-lived. When activity picks up again, the pressures return, potentially stronger, because weaker periods are when the sector tends to stop investing in its own capacity and productivity.
Damon Roast, Construction Economist, WT
Housing is the other moving part. The report says federal tax changes and higher interest rates are weighing on residential construction in the near term, while the underlying need for new homes keeps growing. “The housing downturn is holding activity back today, but the shortfall isn’t going away,” Roast said. “When efforts to address it ramp up, they will land on a construction sector that is already stretched.”

The two coasts have their own stories. The Gold Coast is in what WT calls a prolonged period of record activity, with a substantial lift in residential building approvals from an already high base and population growth holding close to 2 per cent. The Sunshine Coast is a smaller market carrying a broader program of Games-related work, including rail, road and The Wave, and its infrastructure escalation is forecast to reach 9.0 per cent in 2028. Further north, Cairns faces infrastructure escalation of 8.0 per cent in 2027 as a cyclical high in its own pipeline, led by Cairns Hospital and the Barron River bridge, coincides with the strength of the south-east.
Elsewhere, building escalation from 2027 to 2029 is forecast to average 6.1 per cent a year in Perth, 5.7 per cent in Adelaide, 4.8 per cent in Melbourne, which WT expects to see a belated lift in conditions, and 4.6 per cent in Sydney. Canberra has the lowest forecast in the country at 4.0 per cent.

WT National Director James Ford said clients should plan for sustained cost pressure. “The sector’s capacity hasn’t kept pace with demand for a long time, and that won’t change quickly,” Ford said. “Clients who build realistic escalation allowances into their plans, lock in scope early and develop procurement strategies that reflect current market conditions will be better placed than those who simply wait for conditions to soften.”
Over the longer term the report points to productivity as the way through. It says advances in artificial intelligence could trigger an overdue improvement in the sector’s capability, first through modern methods of construction and then through growth in robotics, most likely from the 2030s, provided the industry adopts them broadly.
WT’s figures for 2026 and 2027 are business-as-usual forecasts that leave out the direct cost impacts of the Middle East conflict, which the firm says vary too much by project type to roll into a single number. Its base case is that those direct impacts continue through the first half of 2027.
Graphics by Brisbane Development using forecasts from WT’s Australian Construction Market Conditions Report, November 2026. Forecasts are general market information and will vary by project.


